Development of a Workflow for Colored Ray Data by TechnoTeam Bildverarbeitung GmbH
The importance of white LEDs has risen continuously over the past years. In many cases, disturbing color fringes appear on white LEDs with a blue chip and a yellow phosphor. To avoid this, different distribution of the blue and the yellow light has to be described for simulation. Therefore, colored ray files are necessary. Nicole Stubenrauch, Development Engineer at TechnoTeam Bildverarbeitung GmbH, explains a workflow and method for creating colored ray files.
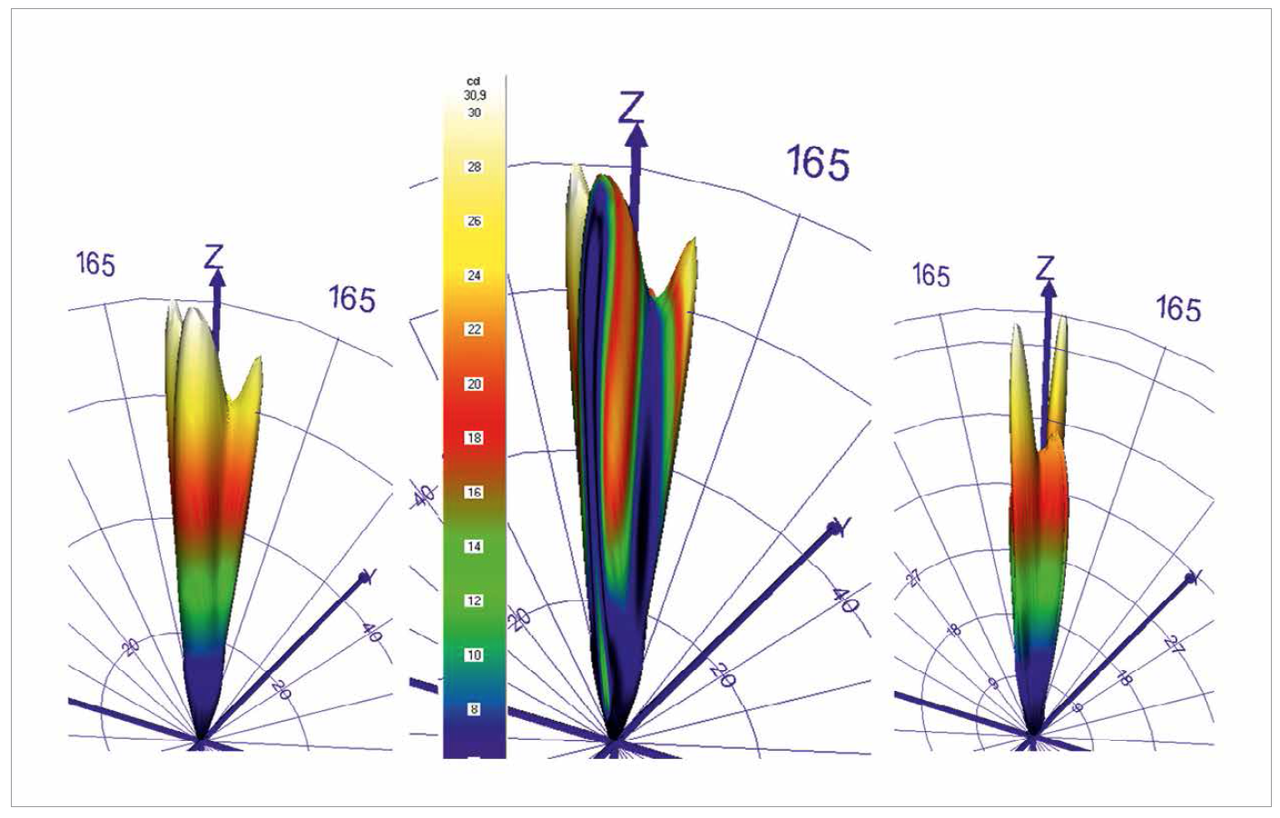
Most light sources emit light of different wavelengths. For a light bulb the spectral power distribution is equal in each direction. This is not the case for many other light sources, for example, white LEDs with a blue chip and yellow phosphor. The different distribution of the light of different wavelengths has to be measured and used for simulation. In figure 1, different luminous intensity distributions (LID) are shown. The figures on the left and on the right show the distribution of the yellow (left) and the blue (right) light. In the middle, the differences are shown mapped onto the distribution of the yellow light. The differences are easy to see [1].
With colored ray data it is possible to develop a new product with fewer prototypes [5]. It is important to have the opportunity to simulate color fringes of the developed products. For creating colored ray data of white LEDs, a workflow has been devised. Figure 1: Luminous intensity distribution (LID) of a white LED (left: yellow light (LID), middle: comparison of yellow and blue, mapped onto the yellow LID, right: blue light (LID)
Motivation
For simulating color fringes, ray files with spectral characteristics are necessary. Therefore, the light from the white LED has to be split into two ray-files: one ray-file with blue light directly from the chip and one with the phosphor converted yellow light. To split the light into two colors suitable filters are important to sort the rays into the correctly colored ray-file. For simulation both ray-files have to be combined with a spectrum that fits the rays that have been collected in it. To create the blue and the yellow spectrum an integral spectrum has to be measured and divided into two parts. To get the right colors in the simulation, the two ray-files, combined with the spectra, have to be weighted in the simulation software because an agreement between measurement and simulation is very important. In most cases, the ray-file resulting from the workflow consists of the current data, with one wavelength per ray being added. So, all rays together represent the measured spectrum. It is also possible to combine each ray with the whole spectrum. In some software the use of color information is not possible yet. In 2011, Muschaweck described the different possibilities to integrate color information into the simulation software [4]. In the last years, much of the available software has changed, but nearly all programs still have different formats. So, there is a big amount of data to be generated and saved on the server for the LED manufacturer, as explained in [4]. In 2013, a new standard format [3] was published by the IESNA. In [6], it is described how the different formats could be used and integrated in the software. Besides the method explained in this article, there are some further approaches described by Rykowski in [7]. He does not only use an integral spectrum, instead he measures the color at each point and determines the wavelength using an algorithm out of it. - The workflow is shown in figure 2.
 Figure 2: Steps involved in the workflow
Development of the Workflow
Integral spectrum
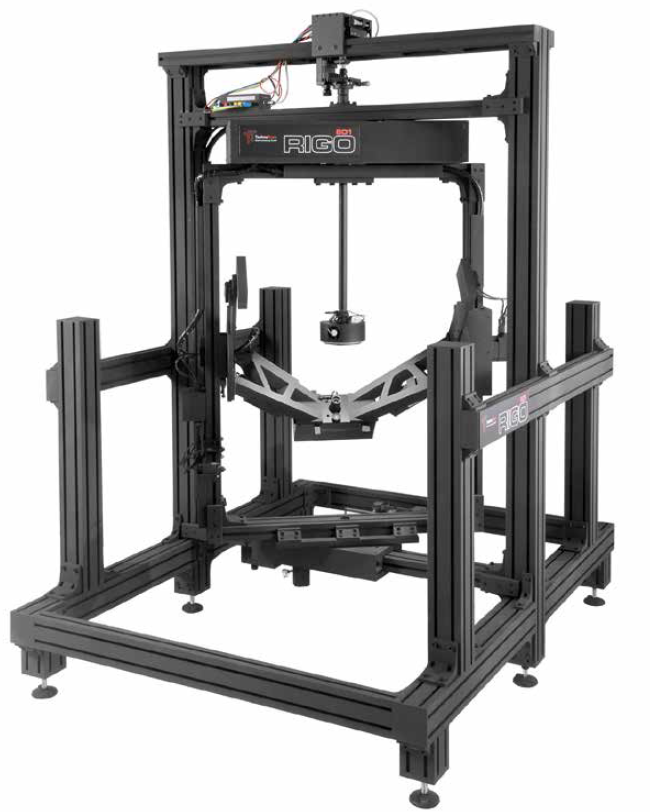
The first step in this workflow consists of the measurement of an integral spectrum. For this, a sphere or a goniophotometer equipped with a spectrometer can be used. For the present research work, the goniophotometer in figure 3 was used, as it is necessary also for measuring the luminous intensity distribution and the ray data. When measuring the spectrum at various points (e.g. ΔΦ=90°; Δθ=10°), weighting with the appropriate solid angle an integral spectrum is calculated.
 Figure 3: Goniophotometer used in this investigation
Separated spectra
To create two separated spectra out of the integral one a cut is necessary. Therefore, different possibilities were investigated. A simple cut at the local minimum between the blue and yellow spectral part is the easiest way. Also, functions can be used for an approximation at the curve. Investigations have shown that approximations with a Gaussian distribution or a tangent are comparable.
For the present research work, an integral spectrum has been created out of two single spectra. By dividing this into two spectra again using the algorithm, it can be shown how the different functions for the approximation fit the real spectra. Furthermore, the simulation results have been compared. In figure 4, an integral spectrum with different spectra resulting after dividing is shown. It can be said that all three kinds of separating a spectrum are possible: the cut at the local minimum, as well as the approximation with a Gaussian distribution or a tangent. These methods have been proved through simulation.
 Figure 4: A typical spectrum divided into two spectra. The two spectra are produced with a simple cut (green) or by approximation with a Gaussian distribution (straight line) or a tangent (broken line)
Two ray files
The spectra found need a ray file whose rays could be characterized by them. Therefore, it is necessary to measure two luminous intensity distributions, namely the blue and the yellow one. To sort the light into the two ray files, suitable filters have to be chosen. In the investigations for this workflow three kinds of filters were examined. They are shown in the following graph (Figure 5). Broadband filters for blue and yellow light (1 and 2), both filters for the X (lambda)-function (3 and 4), as well as interference filters (5 and 6). To decide which filters fit best, the percentage of rays measured by using the other respective filter is investigated, i.e., the portion of blue rays prevailing in the ray file is measured by using the filter for yellow light.
For different spectra the percentage of wrong rays amounts to 13% for filters 1 and 2, and to only 4% for filters 3 and 4. Furthermore, filters 3 and 4 are used very often because they are necessary for the measurement of the chromaticity coordinate. Finally, the interference filters were tested. They have to be chosen, with the spectra being well known. Consequently, they are not as easy to use as the other ones. On the other hand, the error because of wrongly sorted rays is very small. The use of these filters is sensitive to small changes to the setup.
Therefore, the use of filters 3 and 4 is advisable. They are easy to handle and suitable for all considered spectra. The error concerning wrong rays is small, and sensitivity is low. In addition, the filters are already available in most labs.
Data connection
After measuring the integral spectrum and dividing it into two parts as well as measuring the two ray data by using the filter chosen, they have to be combined. For this, tools are integrated in most of the simulation software or in the software of the measuring devices. A spectrum and a normal ray file can be put in there, and a ray file with one wavelength per ray will result.
Weighting
The next step is the weighting of both colored ray files to fit simulation and reality. To get the weights the proportion of the integral of the blue and the yellow part of the spectrum has to be calculated. This can be done for photometric and radiometric spectra. The relation has to be determined in luminous flux [lm] or radiant intensity [W] and integrated in the software or directly in the ray file.
 Figure 5: Various characteristics of the filter developed
Simulation
To create a useful simulation, it is necessary to know how the color is integrated. Different kinds of software present different principles of integration. In some software it is not possible to include color information. On the other hand, most kinds of software add one wavelength to each ray as can be seen in figure 6, whereas some other kinds allow a whole spectrum to be attached to each ray.
If each ray is assigned one wavelength all rays together represent the spectrum, but if only a few rays are picked up by the detector, the spectrum could greatly differ from the real spectrum, because the individual wavelengths are statistically distributed over the rays. Moreover, the time for simulation does not rise with integration of color. If the whole spectrum is integrated in each ray, the time for simulation is obviously longer, but also a small number of collected rays provide good results. So, both ways are acceptable, but the user has to know about the characteristics to interpret the simulation in the right way.
 Figure 6: List of rays in a ray file with one wavelength per ray
Conclusion
In conclusion it can be said that it is possible to create colored ray data for the simulation of white LEDs. Therefore, it is necessary to measure an integral spectrum and divide it into two spectra, a yellow and a blue one. For this, a simple separation through a cut at the local wavelength is accurate enough in most cases. Also, the ray data has to be measured using a filter that is suitable for both spectra. The smallest error and good handling is possible with both filters for the X (lambda)- function. The combination of spectra and ray data can be achieved by means of the software or by the manufacturer of the goniophotometer supplier. The weight has to be included relating to the integral of the two spectra.
This workflow has only been tested for white LEDs with a blue chip and a yellow phosphor; the application for other light sources has to be proven. In the future, it will also be possible to investigate other phosphors to close the gap between both parts of the spectrum. The separation into two spectra will be more complex then. At least one company [6] represents different color bins of LEDs through different weights of the two ray files in the simulation. In the framework of this investigation, however, this has not been tested and remains to be done in the future.
References:
[1] Gaßmann, Frank: Entwicklung eines Verfahrens zum Vergleich von Lichtstärkeverteilungskörpern, TU Ilmenau, Abschlussarbeit, 2013
[2] Hansen, Dirk; Paul, Simon; Schumacher, Volker: LED Measurement to Obtain Polychromatic Raydata and their Value for Simulation. In: LED professional Symposium 2012
[3] Norm September 2013. Ray File Format for the Description of the Emission Property of Light Sources. – IES TM-25-13
[4] Muschaweck, Julius: What‘s in a ray set: Moving towards a unified ray set format. In: SPIE 8170, Illumination Optics II, 2011
[5] Nicholson, Mark: Accurately model LED sources for optimal SSL product designs. In: LEDs Magazine (2012), Dezember
[6] OSRAM Opto Semiconductors (Hrsg.): Importing Rayfiles of LEDs from OSRAM Opto Semiconductors. OSRAM Opto Semiconductors, Februar 2012. – Application Note
[7] Rykowski, Ronald: Spectral Ray Tracing From Near Field Goniophotometer Measurements. In: Light and Engineering (2011)

